> For the complete documentation index, see [llms.txt](https://docs.bugbase.ai/llms.txt). Markdown versions of documentation pages are available by appending `.md` to page URLs; this page is available as [Markdown](https://docs.bugbase.ai/company-guide/vpn-servers/monitor-live-statistics-and-logs.md).
# Monitor Live Statistics and Logs
Monitor all the activities through the VPN server
## Monitor Live Statistics
### 1. **Accessing the Stats Page**
1. To view live statistics, go to your VPN servers list from company dashboard.
2. Click on the specific VPN you want to monitor.
3. Choose the **"Stats"** tab.
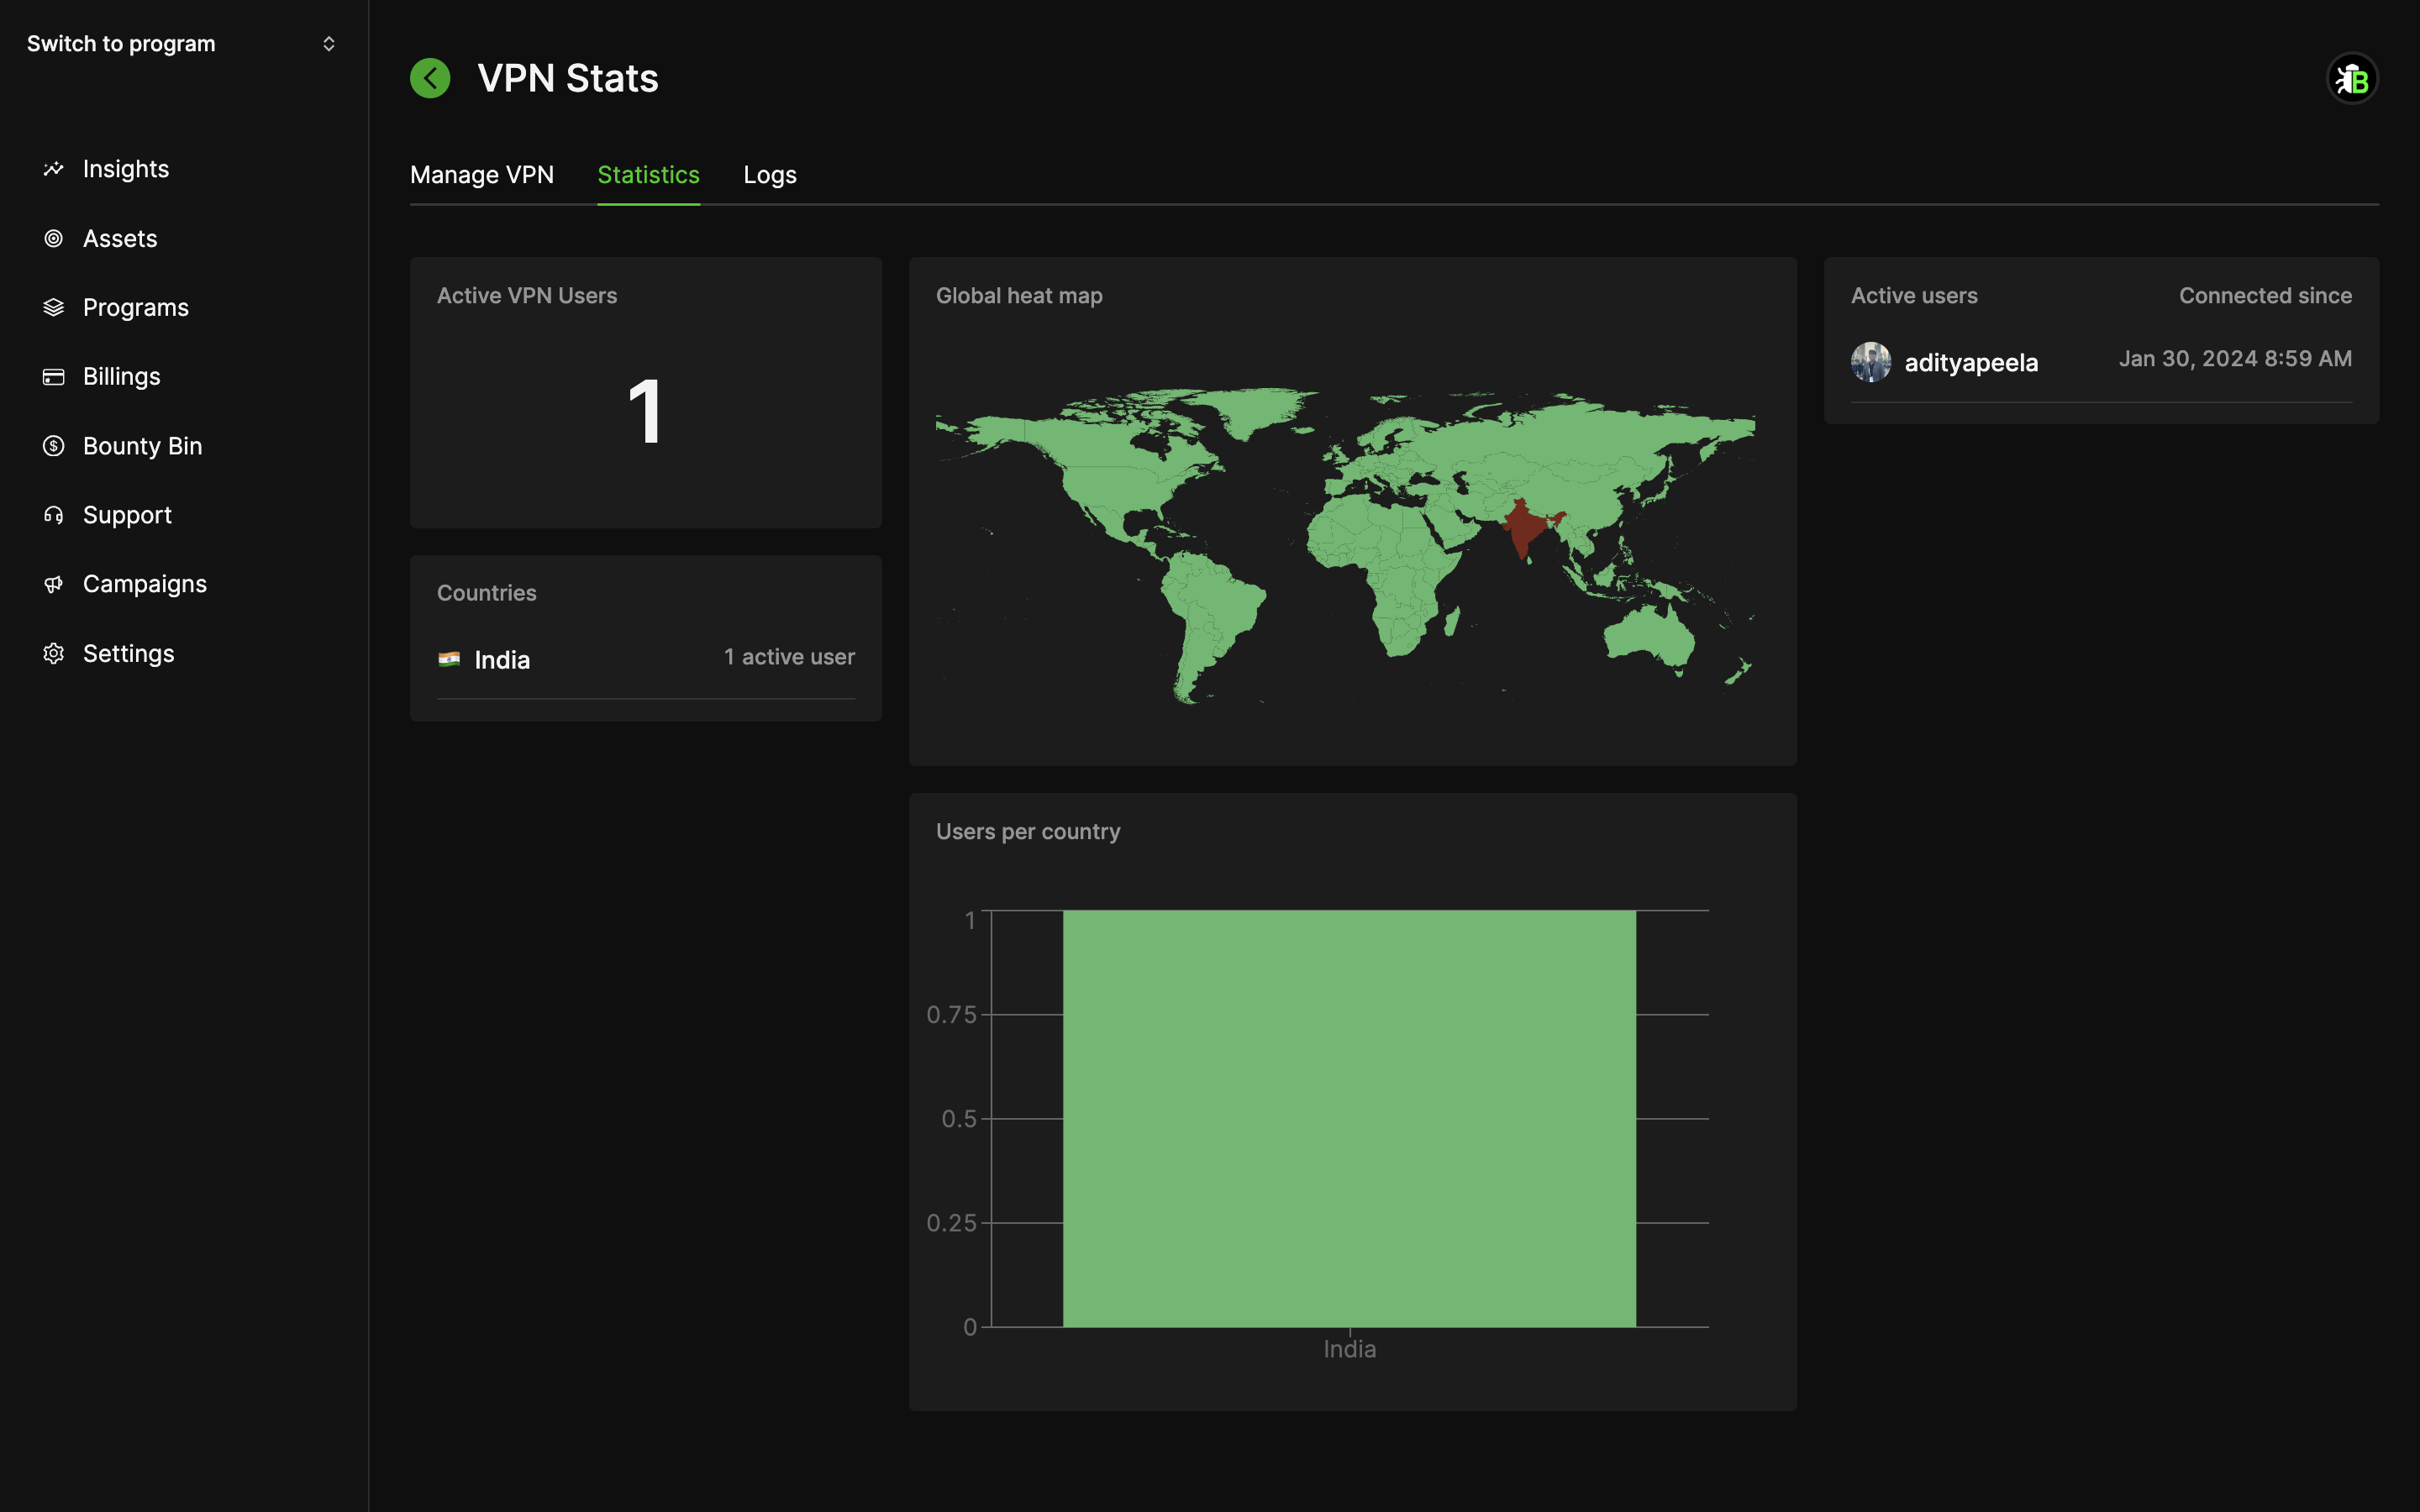
VPN Live stats dashboard
## 2. Features of Stats Page
In the stats page, you get access to the following details:
1. **Active VPN users:** Displays the total number of users currently connected to the VPN.
2. **Countries:** List of all the countries the users are from and number of users from each country.
3. **Global Heat Map:** Visualizes the distribution of users across the globe.
4. **Users per Country:** Shows a breakdown of users by country.
5. **User Connection Details:** Lists each user along with their connection since timestamp and click on the user to view more details.
User details
## Monitor Logs
### 1. **Accessing the Logs Page**
1. To view live logs, go to your VPN servers list from company dashboard.
2. Click on the specific VPN you want to monitor.
3. Choose the **"Logs"** tab.
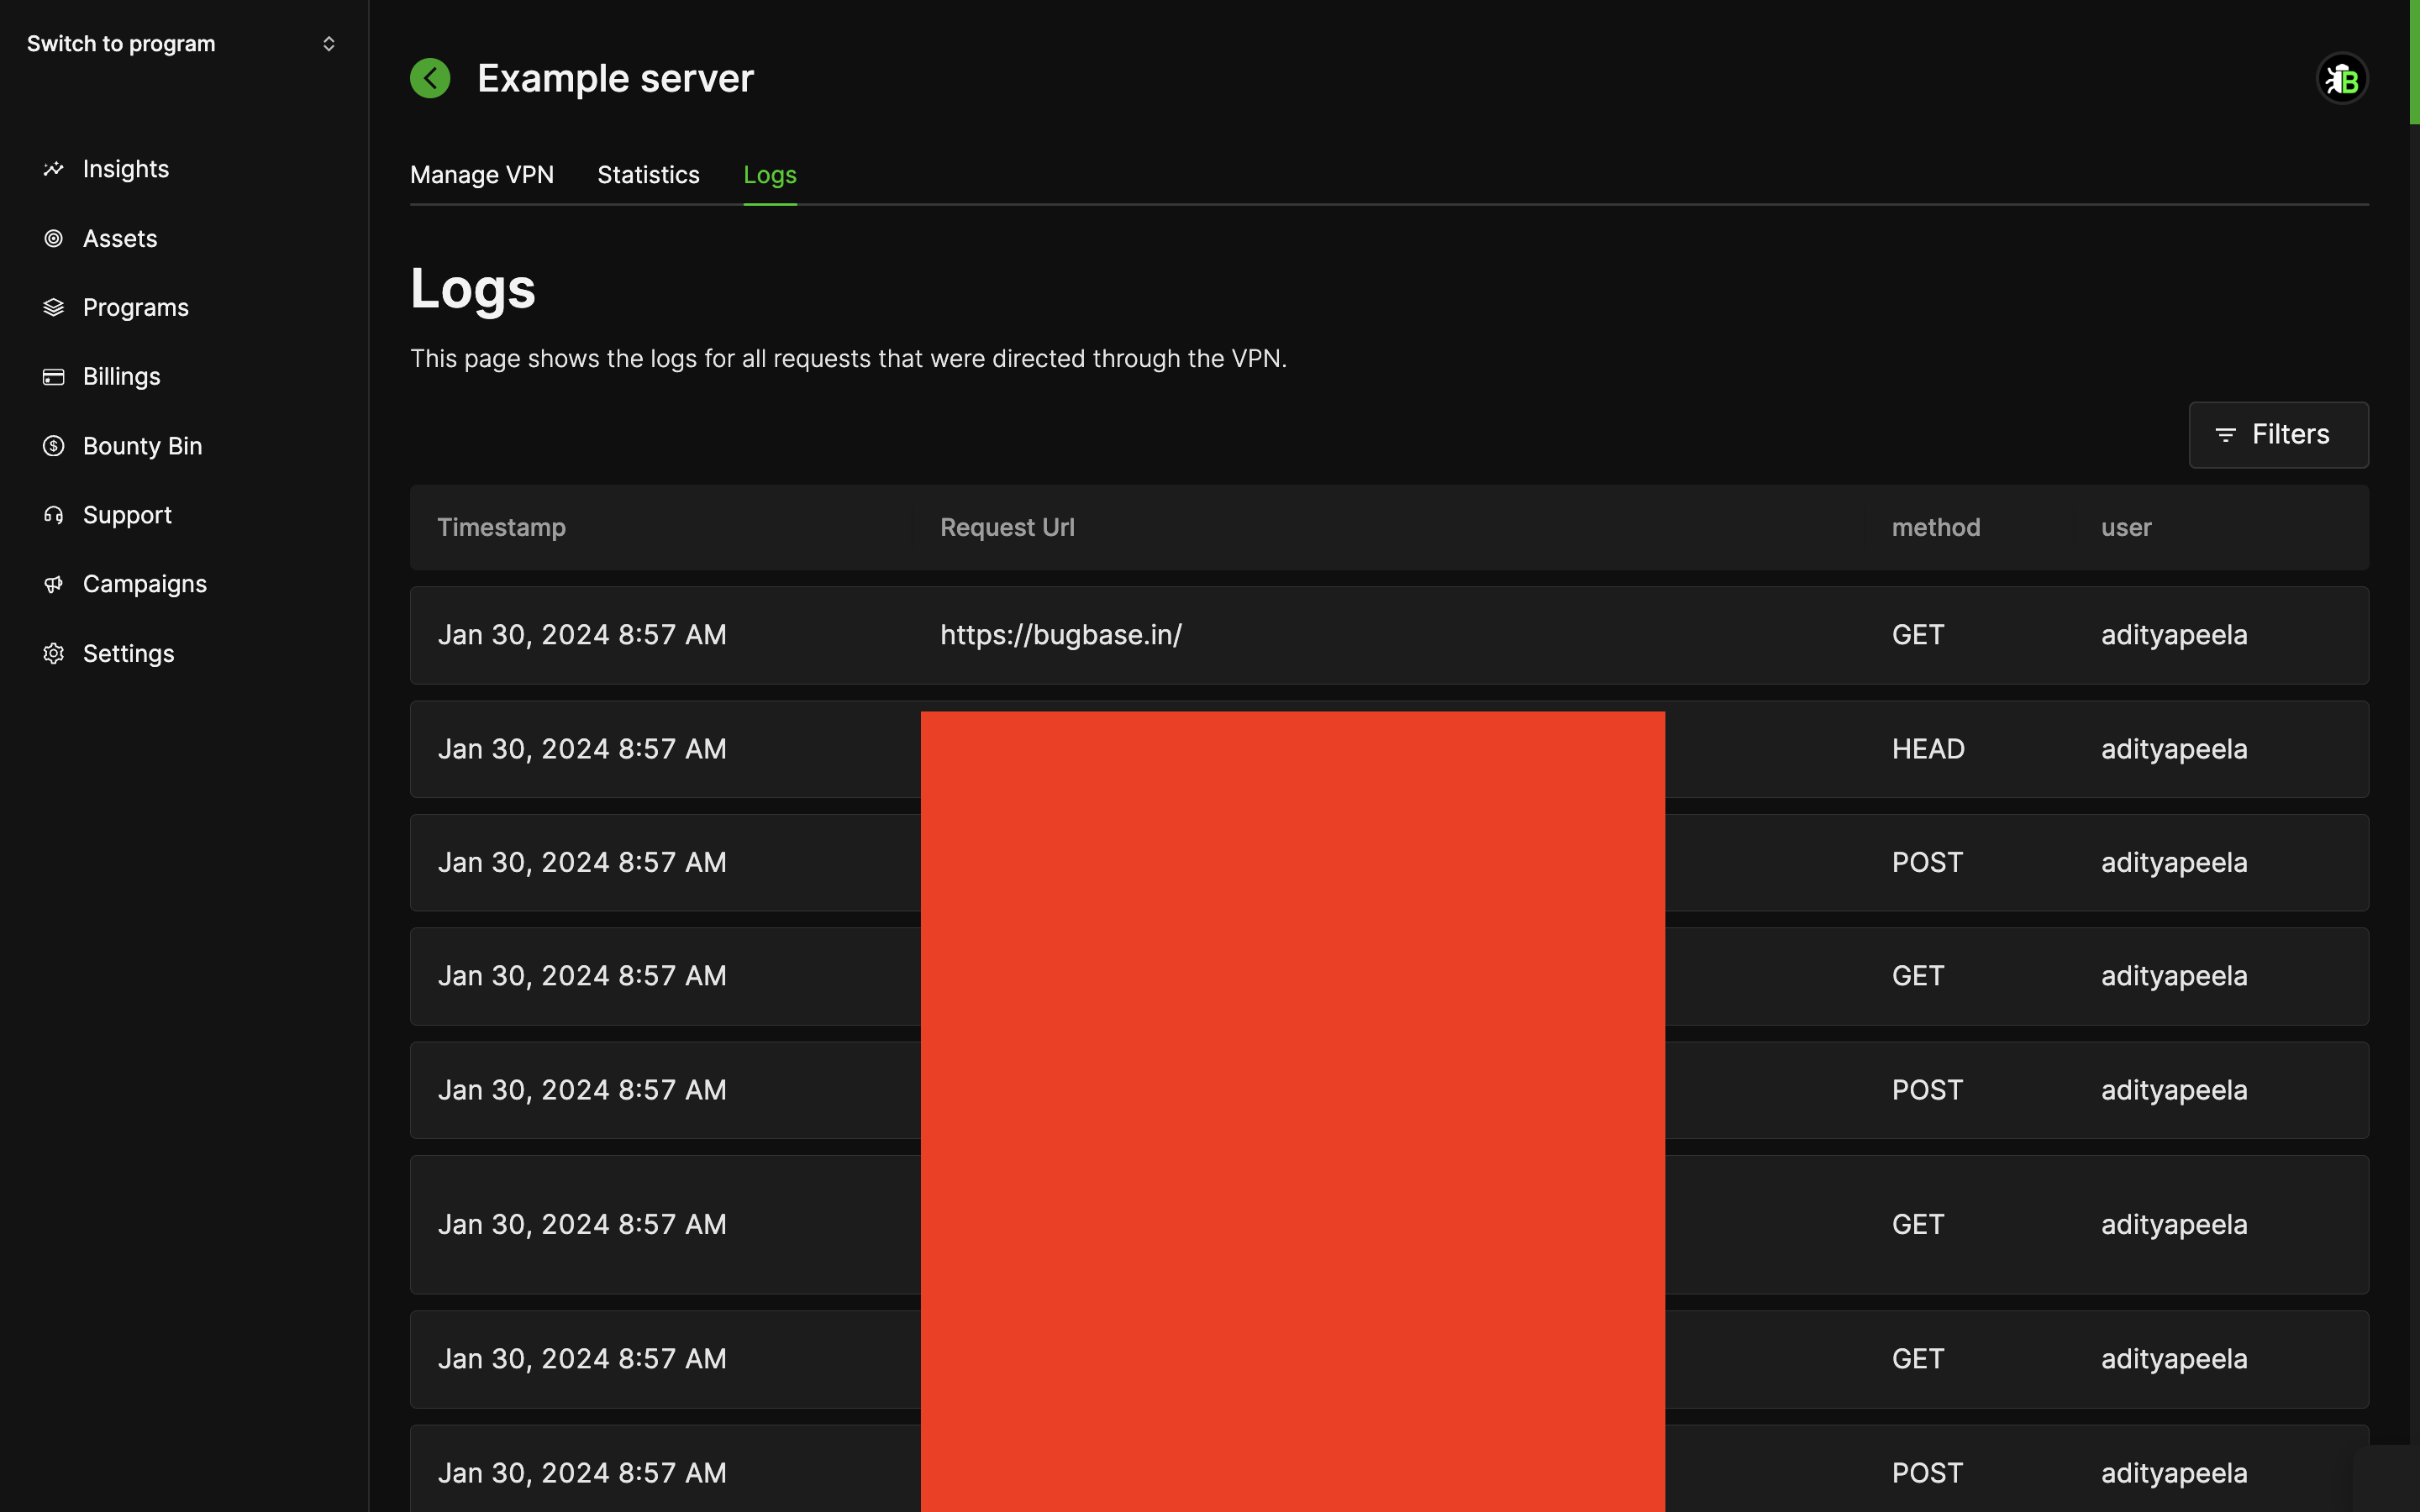
Logs page
## 2. Features of Logs Page
The Logs page shows the connections bug hunters make to your targets through the VPN. Each entry records:
1. **Timestamp:** The exact time the connection was made.
2. **Request URL / Destination:** The target host (and port) the bug hunter connected to.
3. **Username:** The bug hunter who made the connection.
You can filter the logs by username, destination host, and time range, and page through the results.
Log details
{% hint style="info" %}
Logs are captured at the connection level (who connected to which target, and when) — bug hunter traffic is **not** decrypted, so encrypted request contents are never inspected or stored.
{% endhint %}
{% hint style="warning" %}
Statistics and logs populate only while bug hunters are connected and generating traffic. A newly deployed VPN with no active users will show empty stats and logs — this is expected.
{% endhint %}